Back

GraphPad Software
Join the world’s leading scientists and discover how you can use Prism to save time, make more appropriate analysis choices, and elegantly graph and present your scientific research.
Enquire PriceJoin the world’s leading scientists and discover how you can use Prism to save time, make more appropriate analysis choices, and elegantly graph and present your scientific research.
Enquire Price
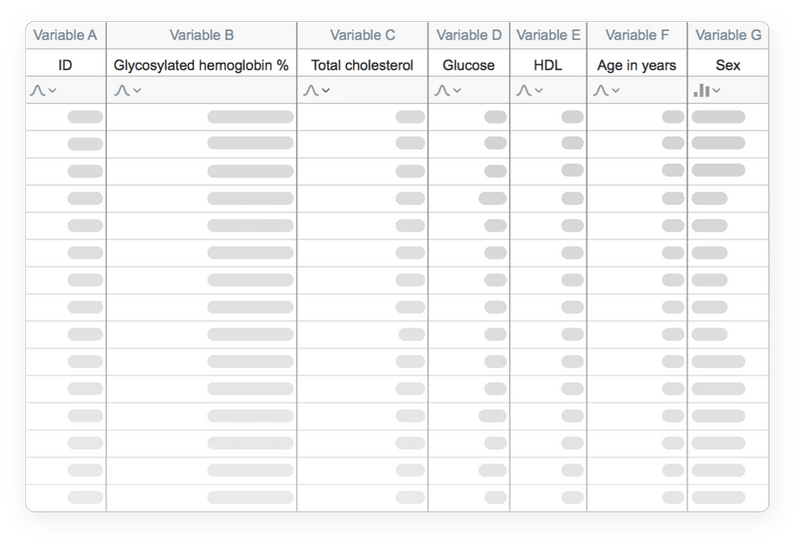
Prism is specifically formatted for the analyses you want to run, including analysis of quantitative and categorical data. This makes it easier to enter data correctly, choose suitable analyses, and create stunning graphs.
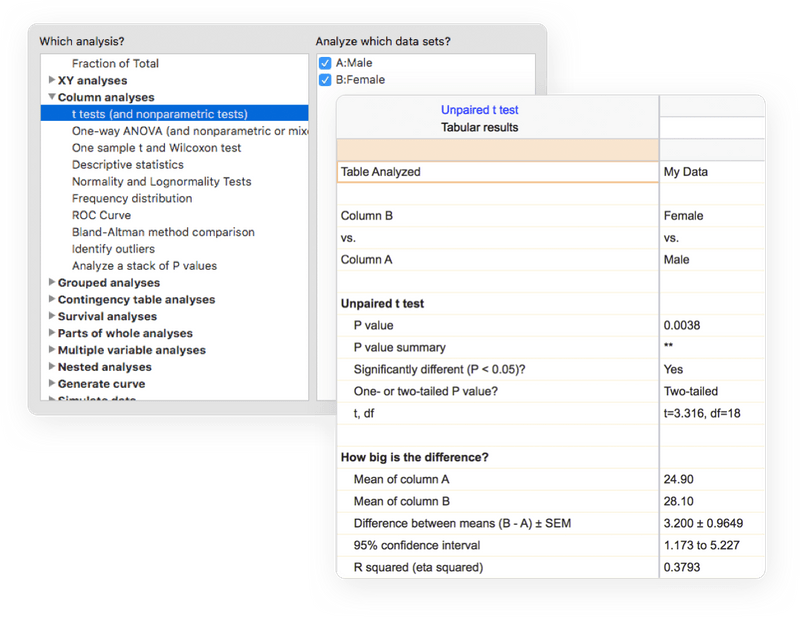
Avoid statistical jargon. In clear language, Prism presents an extensive library of analyses from common to highly specific— t tests, one-, two- and three-way ANOVA, linear and nonlinear regression, dose-response curves, binary logistic regression, survival analysis, principal component analysis, and much more. Each analysis has a checklist to help you understand the required statistical assumptions and confirm you have selected an appropriate test.
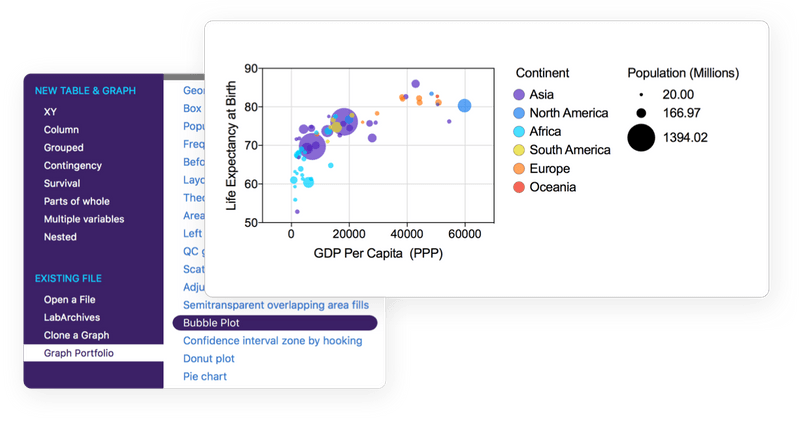
Reduce the complexity of statistics. Prism’s online help goes beyond your expectations. At almost every step, access thousands of pages from the online Prism Guides. Browse the Graph Portfolio and learn how to make a wide range of graph types. Tutorial data sets also help you understand why you should perform certain analyses and how to interpret your results.
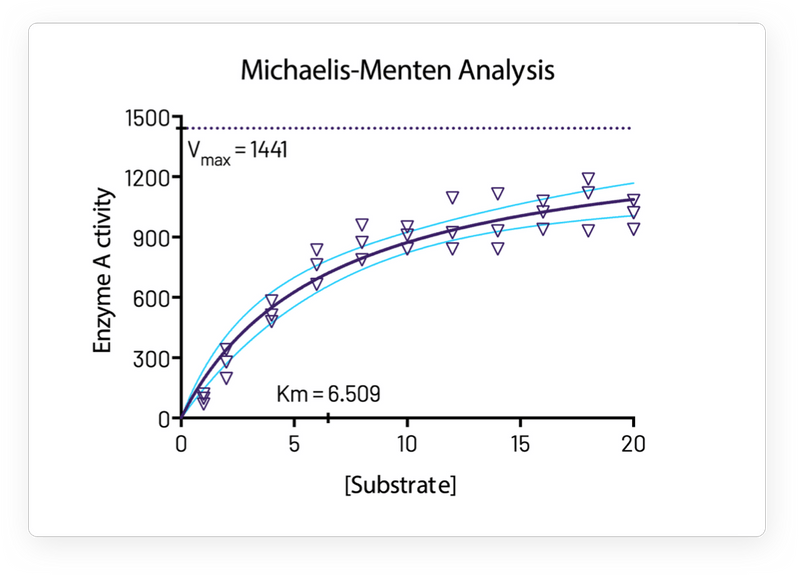
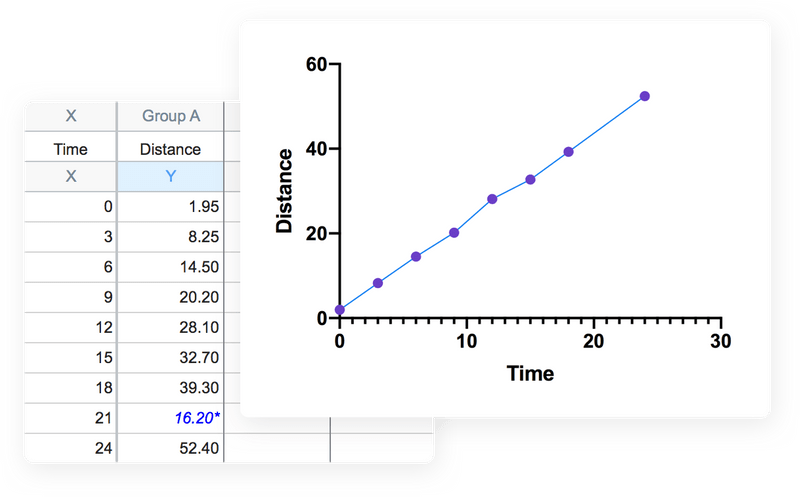
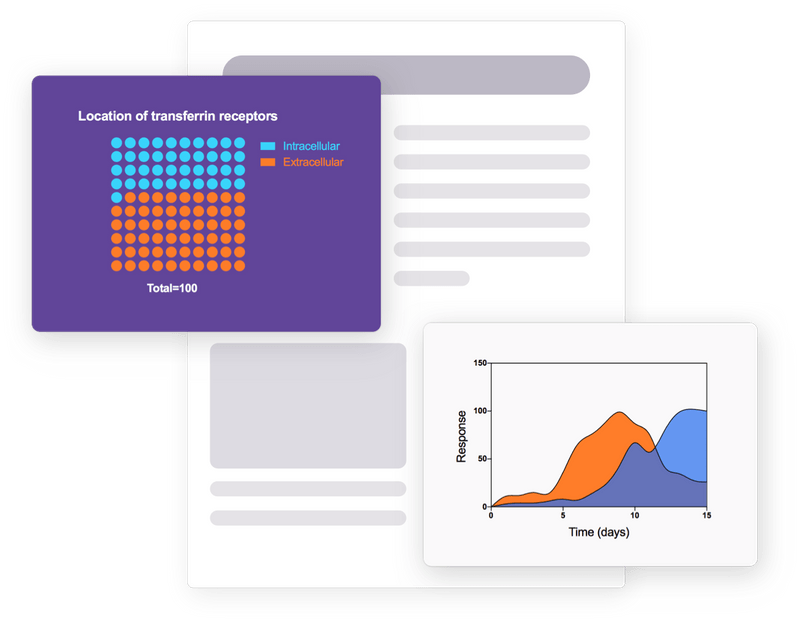
No other program simplifies curve fitting like Prism. Select an equation and Prism does the rest—fits the curve, displays a table of results and function parameters, draws the curve on the graph, and interpolates unknown values.
Prism handles the coding for you. Graphs and results are automatically updated in real time. Any changes to the data and analyses— direct entry of data, omitting erroneous data, correcting typos, or changing analysis choices—are reflected in results, graphs, and layouts instantaneously.
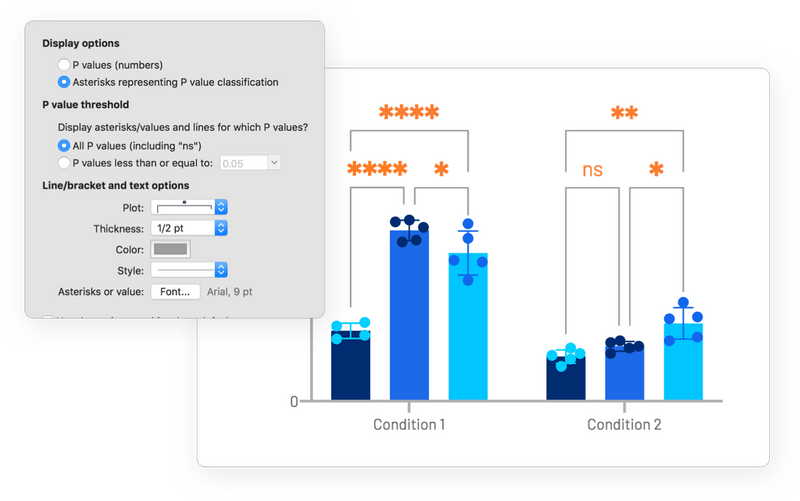
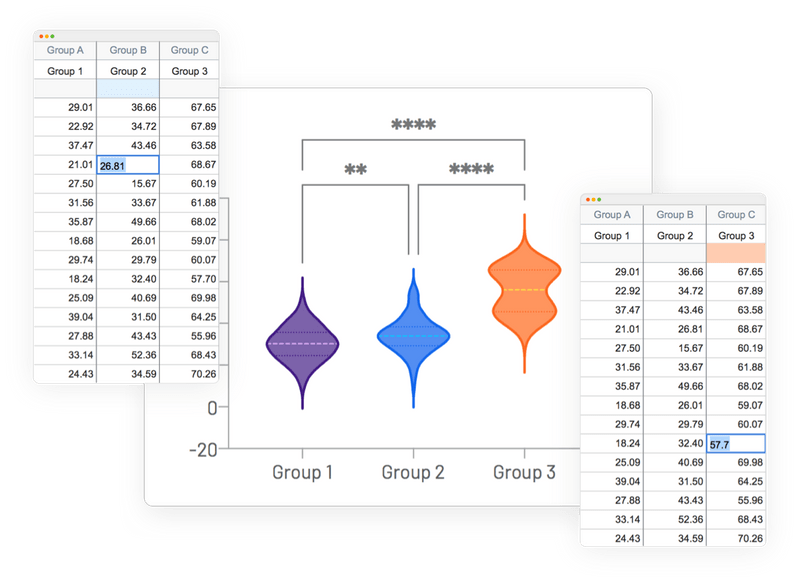
Automatically add multiple pairwise comparisons to your analysis with a single click. For customization options of these lines and asterisks, simply click the toolbar button again. Make adjustments to the data or the analysis, and the results displayed on the graph will update automatically.
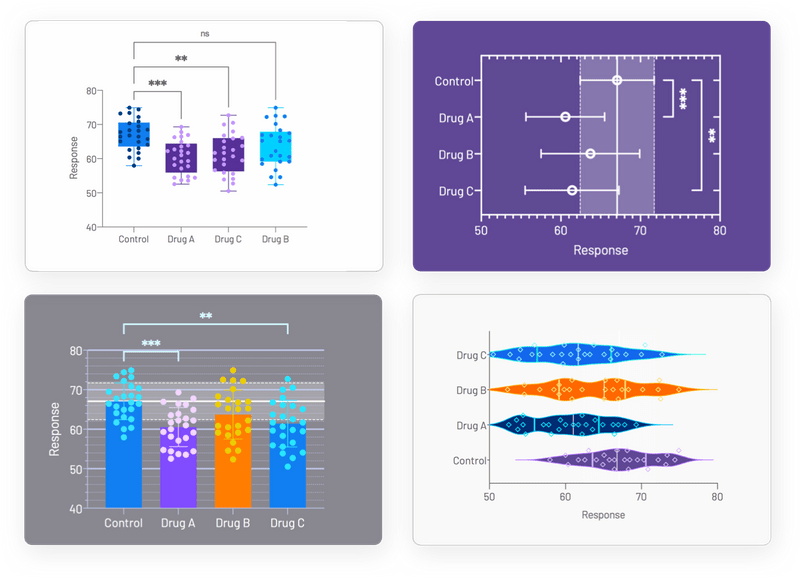
Focus on the story in your data, not manipulating your software. Prism makes it easy to create the graphs you want. Choose the type of graph, and customize any part—how the data is arranged, the style of your data points, labels, fonts, colours, and much more. The customization options are endless.
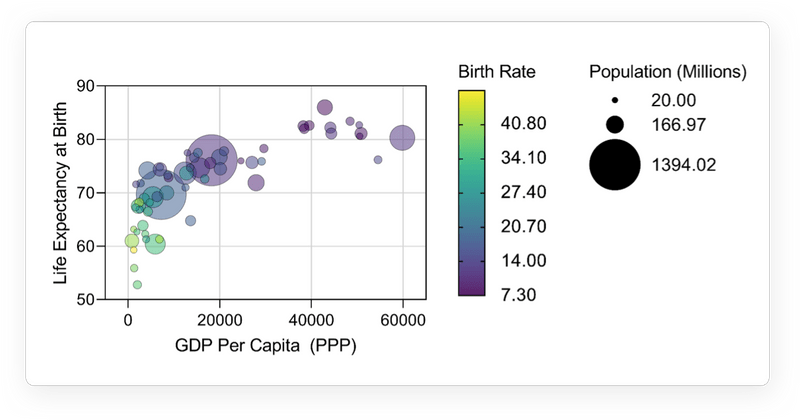
Focus your efforts on analyzing the most relevant data. Customize how you present the relationships in the data to effectively explore large data sets.
Reduce time to publish. Prism allows you to customize your exports (file type, resolution, transparency, dimensions, color space RGB/CMYK) to meet the requirements of journals. Set your defaults to save time.
Share more than your graphs. Prism’s comprehensive record of your data enables effective collaboration with other scientists. All parts of your Prism project (raw data, analyses, results, graphs, and layouts) are contained in a single file that you can share with one click. Now others can easily follow your work at every step, enhancing the clarity of your findings and streamlining your collaborative efforts.
![]()
Since 1989, GraphPad Software has been dedicated to creating software exclusively for the international scientific community. Created by scientists for scientists, our intuitive programs provide researchers worldwide with the tools they need to simplify data analysis, statistics and graphing.