Featured Product
Crayola has been making crayons at its facilities in eastern Pennsylvania for more than 100 years, during which they have become the undisputed leaders in providing crayons and other colorful items children use to express their creativity. Everyone knows the name, but few recognize Crayola’s dedication to ensuring that the 2.2 billion crayons they make every year meet the highest standards.
Crayola relies on a data-driven culture of continuous improvement to enhance the quality of their crayons—not to mention their markers, paints, modelling clay, and other products—and they trust Minitab Statistical Software to analyze that data. “We start with the assumption that everything we do, we can do better,” explains Gary Wapinski, vice president of manufacturing. “And that’s why Minitab is key—it helps us understand the statistical analysis and lets the data reveal where we need to go.”
Crayola’s data-driven approach to solving problems really took off in 2007. That’s the year Pete Ruggiero, executive vice president of global operations, encountered an issue while visiting one of the company’s overseas locations. “I went into a shop and opened a box of our crayons, and some of the labels were coming off,” he recalls. “When I got back, I said ‘We’ve got to get this fixed,’ but there was a dispute about the source of the problem. We wound up doing an elementary Six Sigma project to resolve it.”
Data analysis showed that the adhesive didn’t consistently set properly when the labels were dry. Misting crayons as they went through the labeling machines solved the problem, and that project’s success prompted Crayola to expand the use of statistical methods. In 2008, the company’s initial wave of Six Sigma projects saved more than $1.5 million. Since then, 7 waves of Six Sigma green belts and 3 waves of black belts have completed projects, and all of them have analyzed their data with Minitab.

Hands-on Commitment—from the Top
Rich Titus, a Lean Six Sigma consultant and adjunct faculty member at Lehigh University, trains Crayola’s green and black belts and helps them keep projects on track. He credits Crayola’s leadership with providing the support necessary to initiate and sustain a successful continuous improvement program. “Executives are actively involved in selecting and approving projects, and we gather with project leaders to review their progress every few weeks,” Titus notes. “And even though those review sessions can last up to three hours, the executives aren’t replying to e-mails or stepping out to take phone calls—they’re engaged and asking questions about every project.”
Knowing their leaders take it seriously helps teams appreciate the importance of this data-driven methodology, says James Collins, manager of continuous improvement and Six Sigma at Crayola. “Project leaders need to be able to support their recommendations with data. Having an idea to make something better is great—but when you can prove it with charts and graphs and statistics, then you’ve got the foundation to make a change.”
But Crayola’s leaders don’t just review improvement projects—they do their own. Wapinski’s most recent project saved a quarter of a million dollars. When the project began, highly experienced workers were assigned to oversee small teams of less experienced employees who placed arts and crafts components into kits. “I used Minitab to compare lines led by veteran employees with lines led by the less experienced workers themselves,” he says, “and found no differences in safety, efficiency, or quality. Paying skilled employees to lead these teams gave no benefits, because the kit-assembly process is so limited. So we were able to move these skilled employees to areas where their experience has a real impact.”
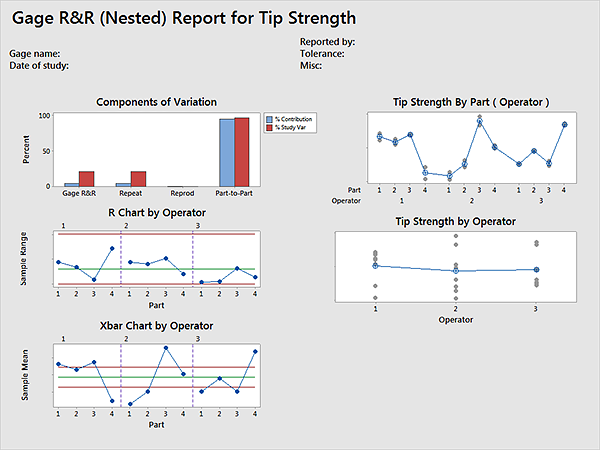
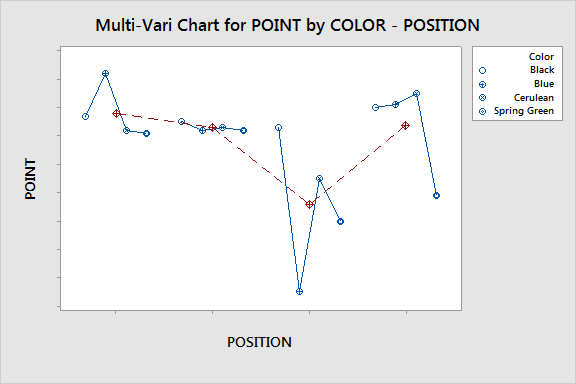
Not surprisingly, many projects at Crayola contribute to the goal of making the perfect crayon. Company engineers used Minitab’s Measurement System Analysis (MSA) and Design of Experiments (DOE) tools to study the breaking strength of crayons—efforts that ultimately led to new standards and even the creation of a new crayon break-testing machine.
“We’ve made crayons for more than 100 years, but we didn’t have a reliable, consistent crayon strength measurement until now,” says Bonnie Hall, vice president for global quality and continuous improvement. “Every time we tested a formula change, we needed to break tens of thousands of crayons to know if we’d made a difference or not. Now it’s much faster and easier to evaluate how strong our crayons are.”
Root Causes and Real Solutions
Gary Wapinski witnessed many poor examples of data analysis before he joined Crayola. “I saw people spend more time trying to figure out how to come up with data that supported their thesis rather than letting the data reveal where they needed to go,” he says.
“Many people do not want to do the hard work of getting to the root cause of a problem. If a piece of equipment shuts down every three minutes, they’d rather just believe that we can buy a new machine to solve the problem. But if the root cause has to do with our processes, materials, or training our people, then a new machine won’t fix anything. I want to make real improvements, not fake ones, so combining disciplined problem solving with a powerful tool like Minitab is something I naturally gravitate toward.”
Using Minitab sometimes turns conventional wisdom on its head—like the time a process was improved by reducing the line speed and cutting the crew from 10 people to 5. “Some people were convinced those changes would mean less output, but the capacity study in Minitab showed that we got the same output at a lower speed with half the labour,” says Wapinski. “Running the machine faster just introduced more downtime and scrap. What’s more, the people working the line were much happier, because they weren’t fighting to keep up with the machine at those higher speeds.”
Although their work may change, no one at Crayola has lost a job as a result of a quality project. “When we started this, employees wondered what we were doing, and whether their jobs would be going away,” Ruggiero says. “Now everyone understands that we’re investing in continuous improvement to increase our competitiveness and preserve jobs.”
Sustaining Improvements
Crayola wants these improvements to be sustainable, and project savings are rolled into the budget. “You can’t just make a PowerPoint and cite the dollars you’ve saved,” says Ruggiero. “We recalculate the standard cost of that process based on those savings, and then we deliver on those savings.”
The use of data also affects Crayola’s suppliers. For instance, the company partnered with a supplier to reduce the amount of defects in corrugated shipping cartons. “We really need perfect cartons,” says Hall. “If they have any warp at all, they don’t run through the automatic case packers.”
That project slashed $56,000 worth of defects to nothing in a single year—and when defects began to reappear, another benefit of paying close attention to the data became evident. “Routine analysis gave us a clear warning as soon as quality started failing, and we worked with the supplier to solve the problem much more quickly as a result.”
A Culture of Data Awareness
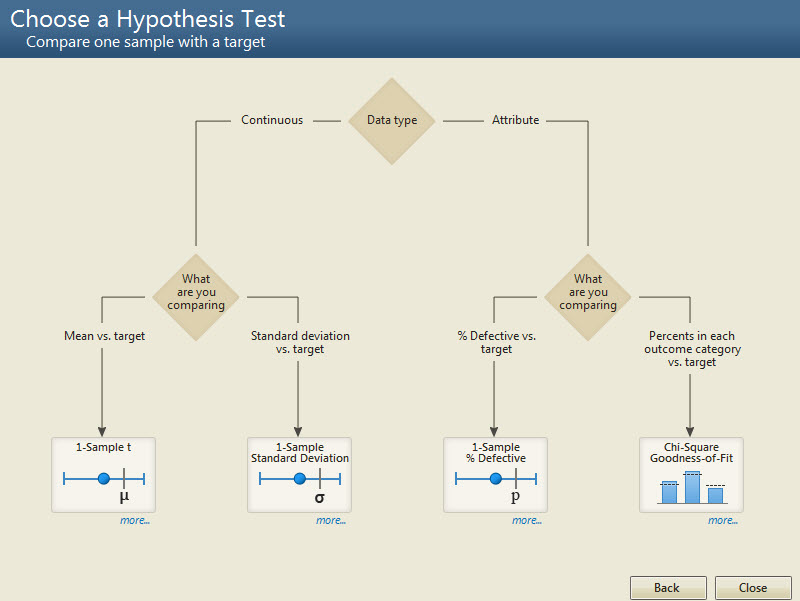
Those involved in Crayola’s quality initiative know it’s a long-term effort. “You don’t flip a switch and suddenly you’re a great company,” says Wapinski. But data analysis using Minitab already is a part of everyday operations. Pareto charts, boxplots, hypothesis tests, control charts, and capability analyses are common sights.
“Minitab is a daily tool for managing and exploring our data,” says Hall. “And because we’re using Minitab, it’s much easier to communicate about business problems. There’s an expectation that you have a good understanding of your data, and that gets us to the root of the problem more quickly.”
Being able to analyze and act on data has transformed the way Crayola does business, and it benefits the entire operation. “It’s allowed us to concentrate resources where we can get the most bang for our buck,” Ruggiero says. “We’ve moved our culture from ‘When you have a problem, bury it,’ to ’We have a problem and we need to make it visible so we can solve it.’”